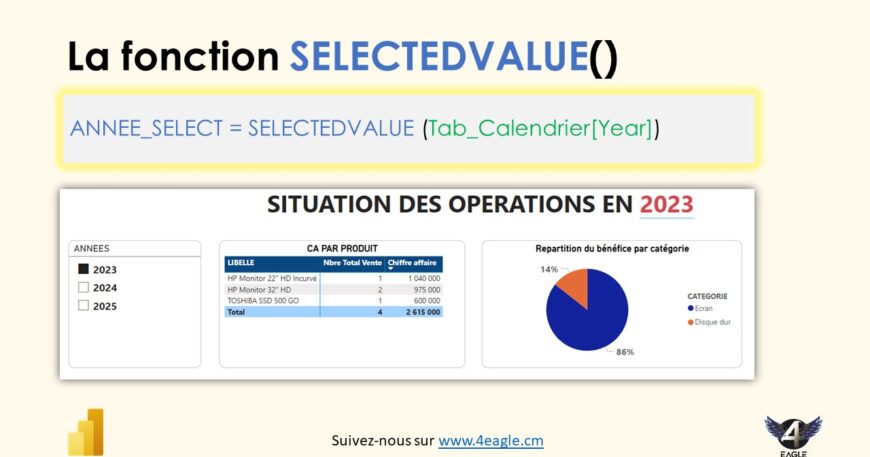
In dashboard design, one of the issues that always comes up is how to create dynamic page or chart titles without having to do so statically, so that the title changes according to the filter selected by the user. This is where the SELECTEDVALUE() function comes into its own.
The SELECTEDVALUE() function in DAX is used to obtain a single value selected in a given context. If several values are selected, it returns an alternative value specified by the user (by default, it returns BLANK()). This function is very useful in Power BI for scenarios such as creating measures dependent on user selection in a slicer.
Syntax

- <column>: The column in which you want to obtain the selected single value.
- [alternateResult] (optional): The value to be returned if more than one value is selected or if no value is selected. If this parameter is not supplied, BLANK() is returned by default.
Examples
- Get a single value selected in a slicer:
Suppose you have a Calendar table (Tab_Calendar) with a Tab_Calendar[Year] column. You want to create a measure that displays the year selected by the user in a slicer.

This measurement returns the selected year if only one year is selected. If several years are selected, it returns “Several Years Selected”.
- Use in conditional measures :
You can also use SELECTEDVALUE to create conditional measures. For example, you may wish to display total sales only for the selected category in a slicer:

In this example, if no category is selected, the measure displays total sales. Otherwise, it calculates sales for the selected category.
- Combination with other DAX functions :
The SELECTEDVALUE function can be combined with other DAX functions for more complex analyses. For example, to calculate the percentage of sales per selected category:

Case studies
- Dynamic filters: SELECTEDVALUE is particularly useful for dynamic reports where users can select different criteria in slicers to view specific results.
- Conditional visualizations: Use SELECTEDVALUE to adapt visualizations to user selections, for example, by displaying dynamic titles or annotations in your charts.
By using SELECTEDVALUE, you can make your Power BI reports more interactive and personalized according to user selections, offering a richer, more intuitive data visualization experience.


